Gut–Kidney Axis on Chip for Studying Effects of Antibiotics on Risk of Hemolytic Uremic Syndrome by Shiga Toxin-Producing Escherichia coli

 , , ,
, , , 
Abstract
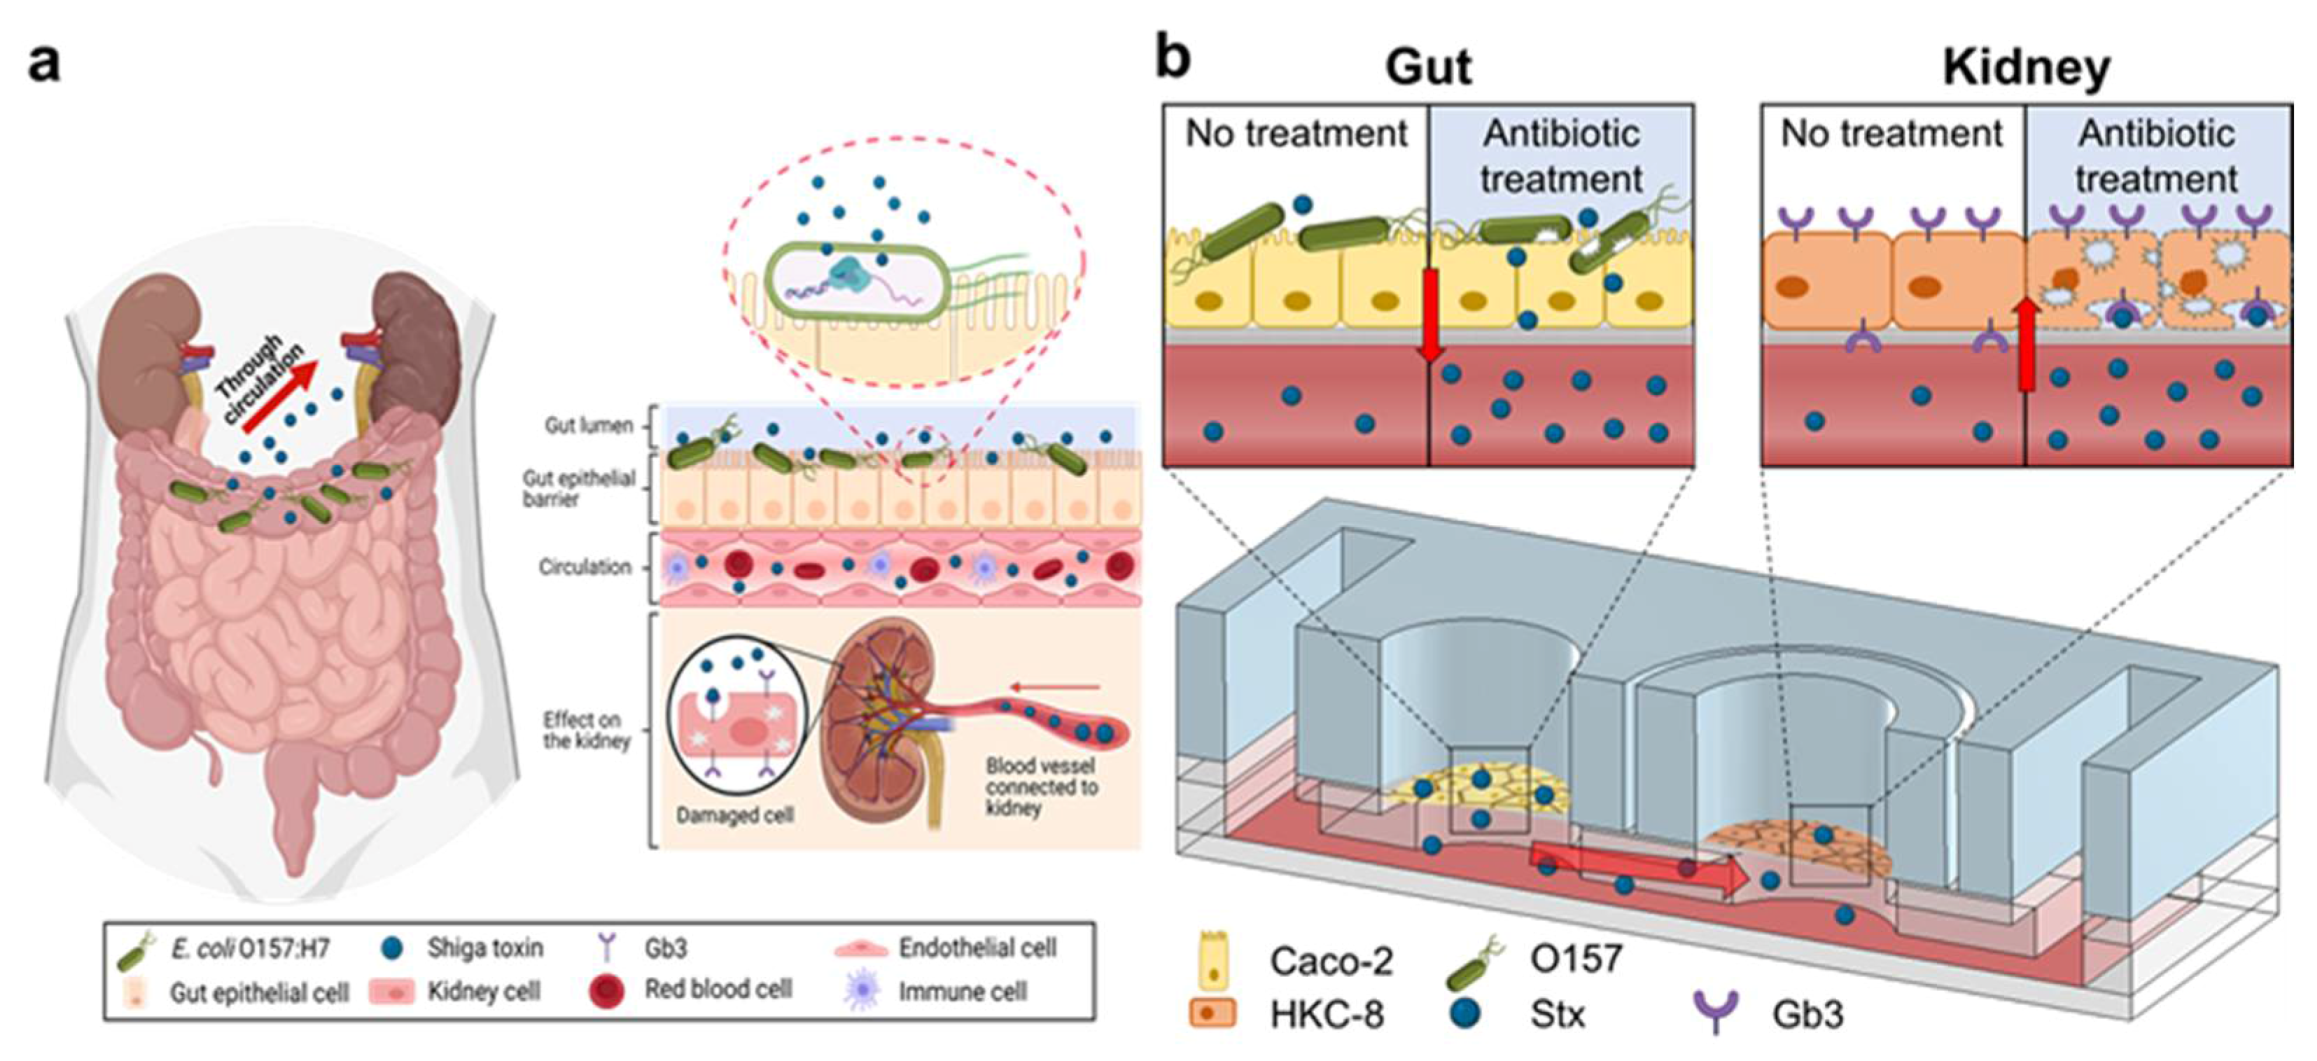
:1. Introduction
2. Results and Discussions
2.1. Fabrication and Operation of GKA on Chip
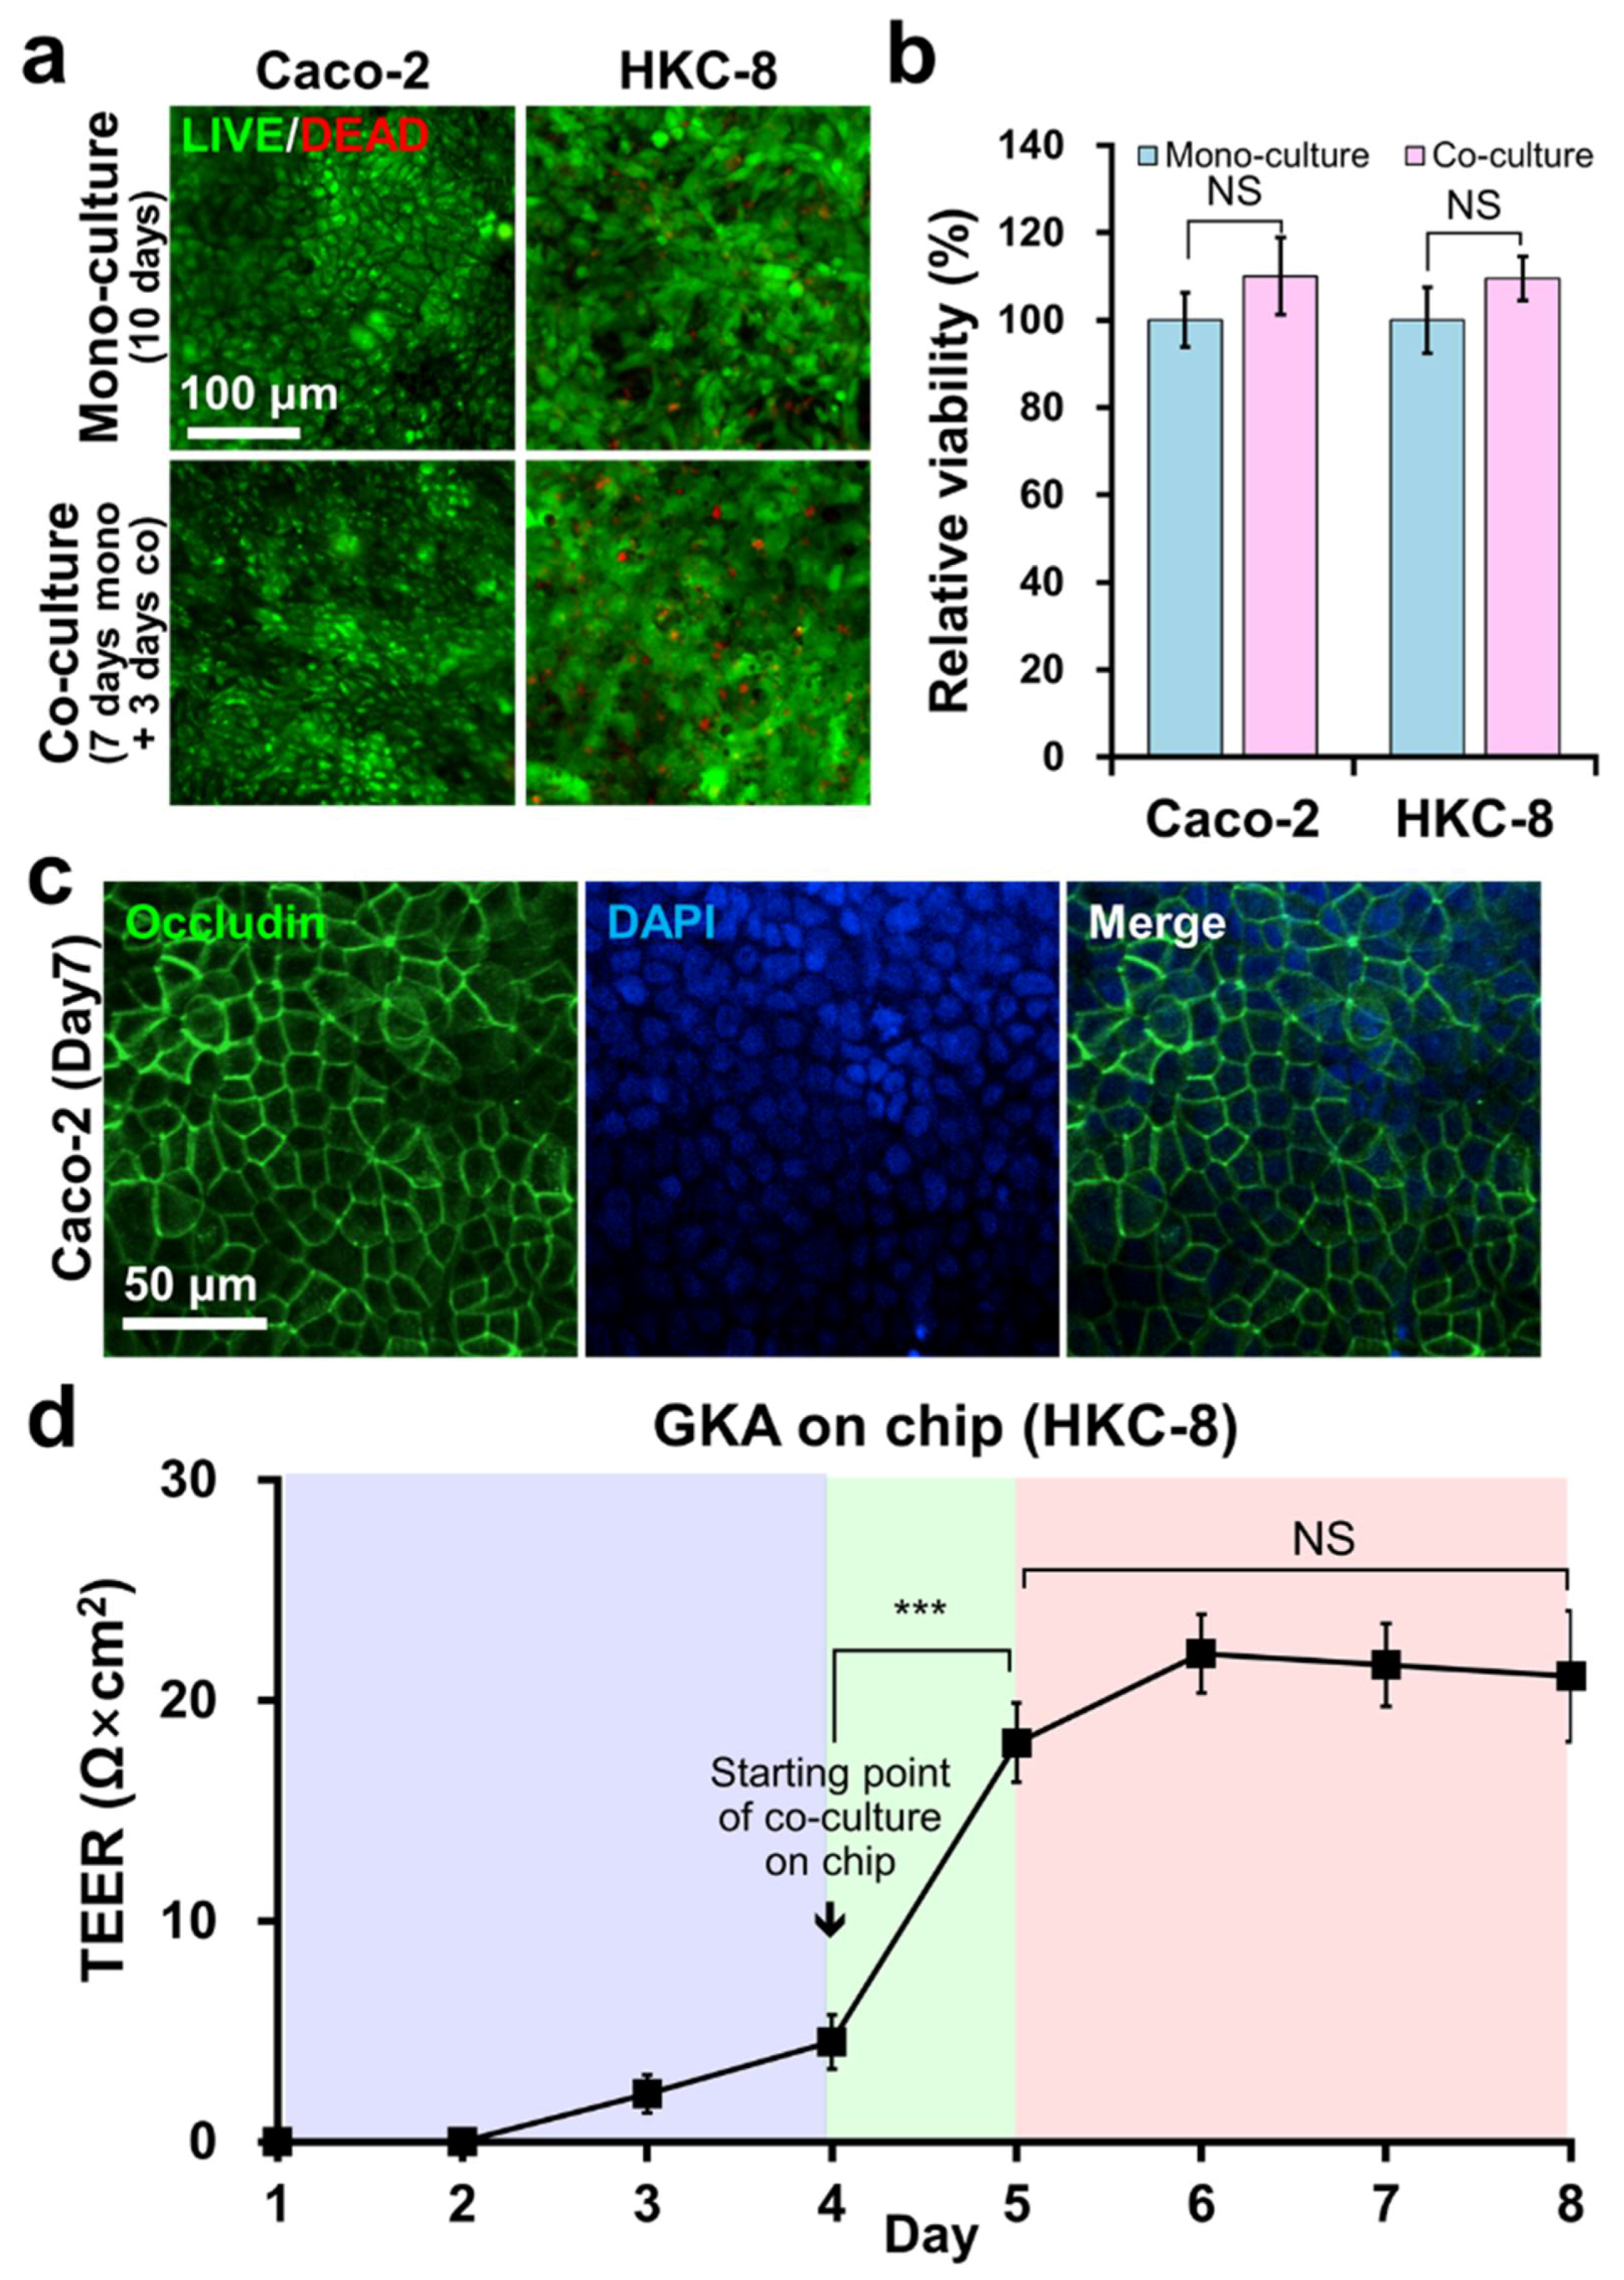
2.2. Co-Culture of Caco-2 and HKC-8 Cells on GKA on Chip
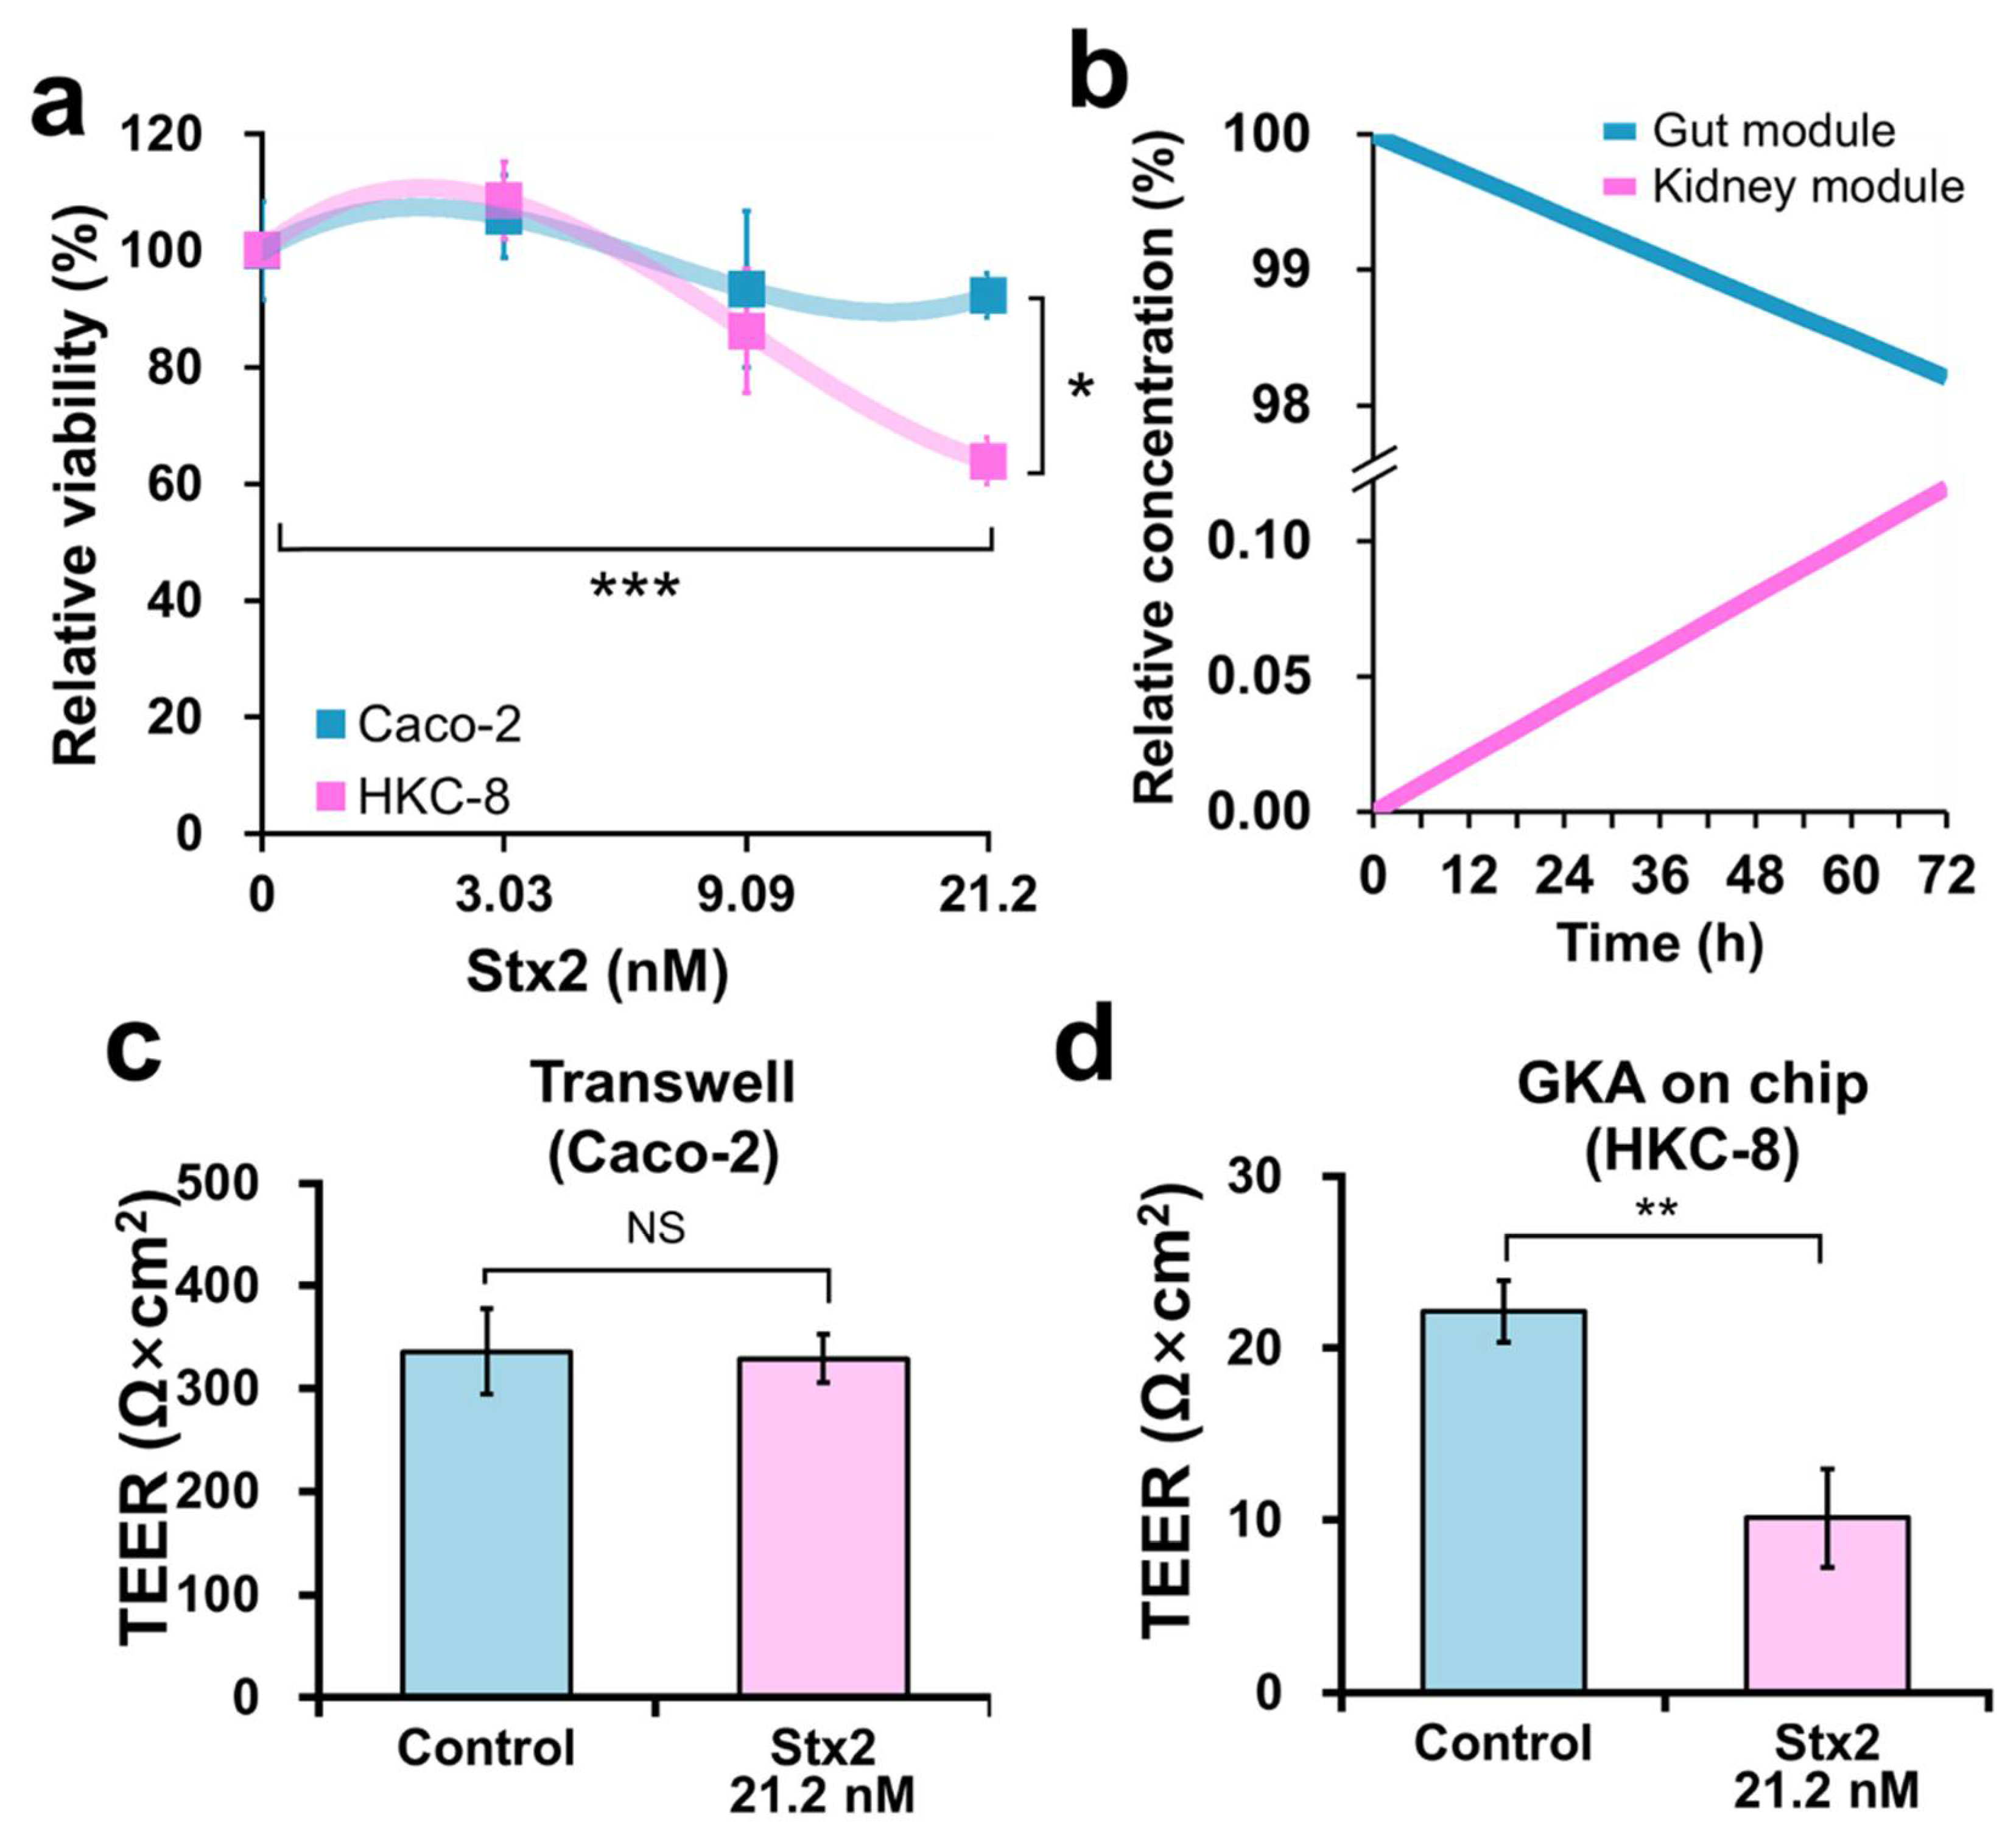
2.3. Effect of Stx2 on Viability and Barrier Integrity of Caco-2 and HKC-8 Cells
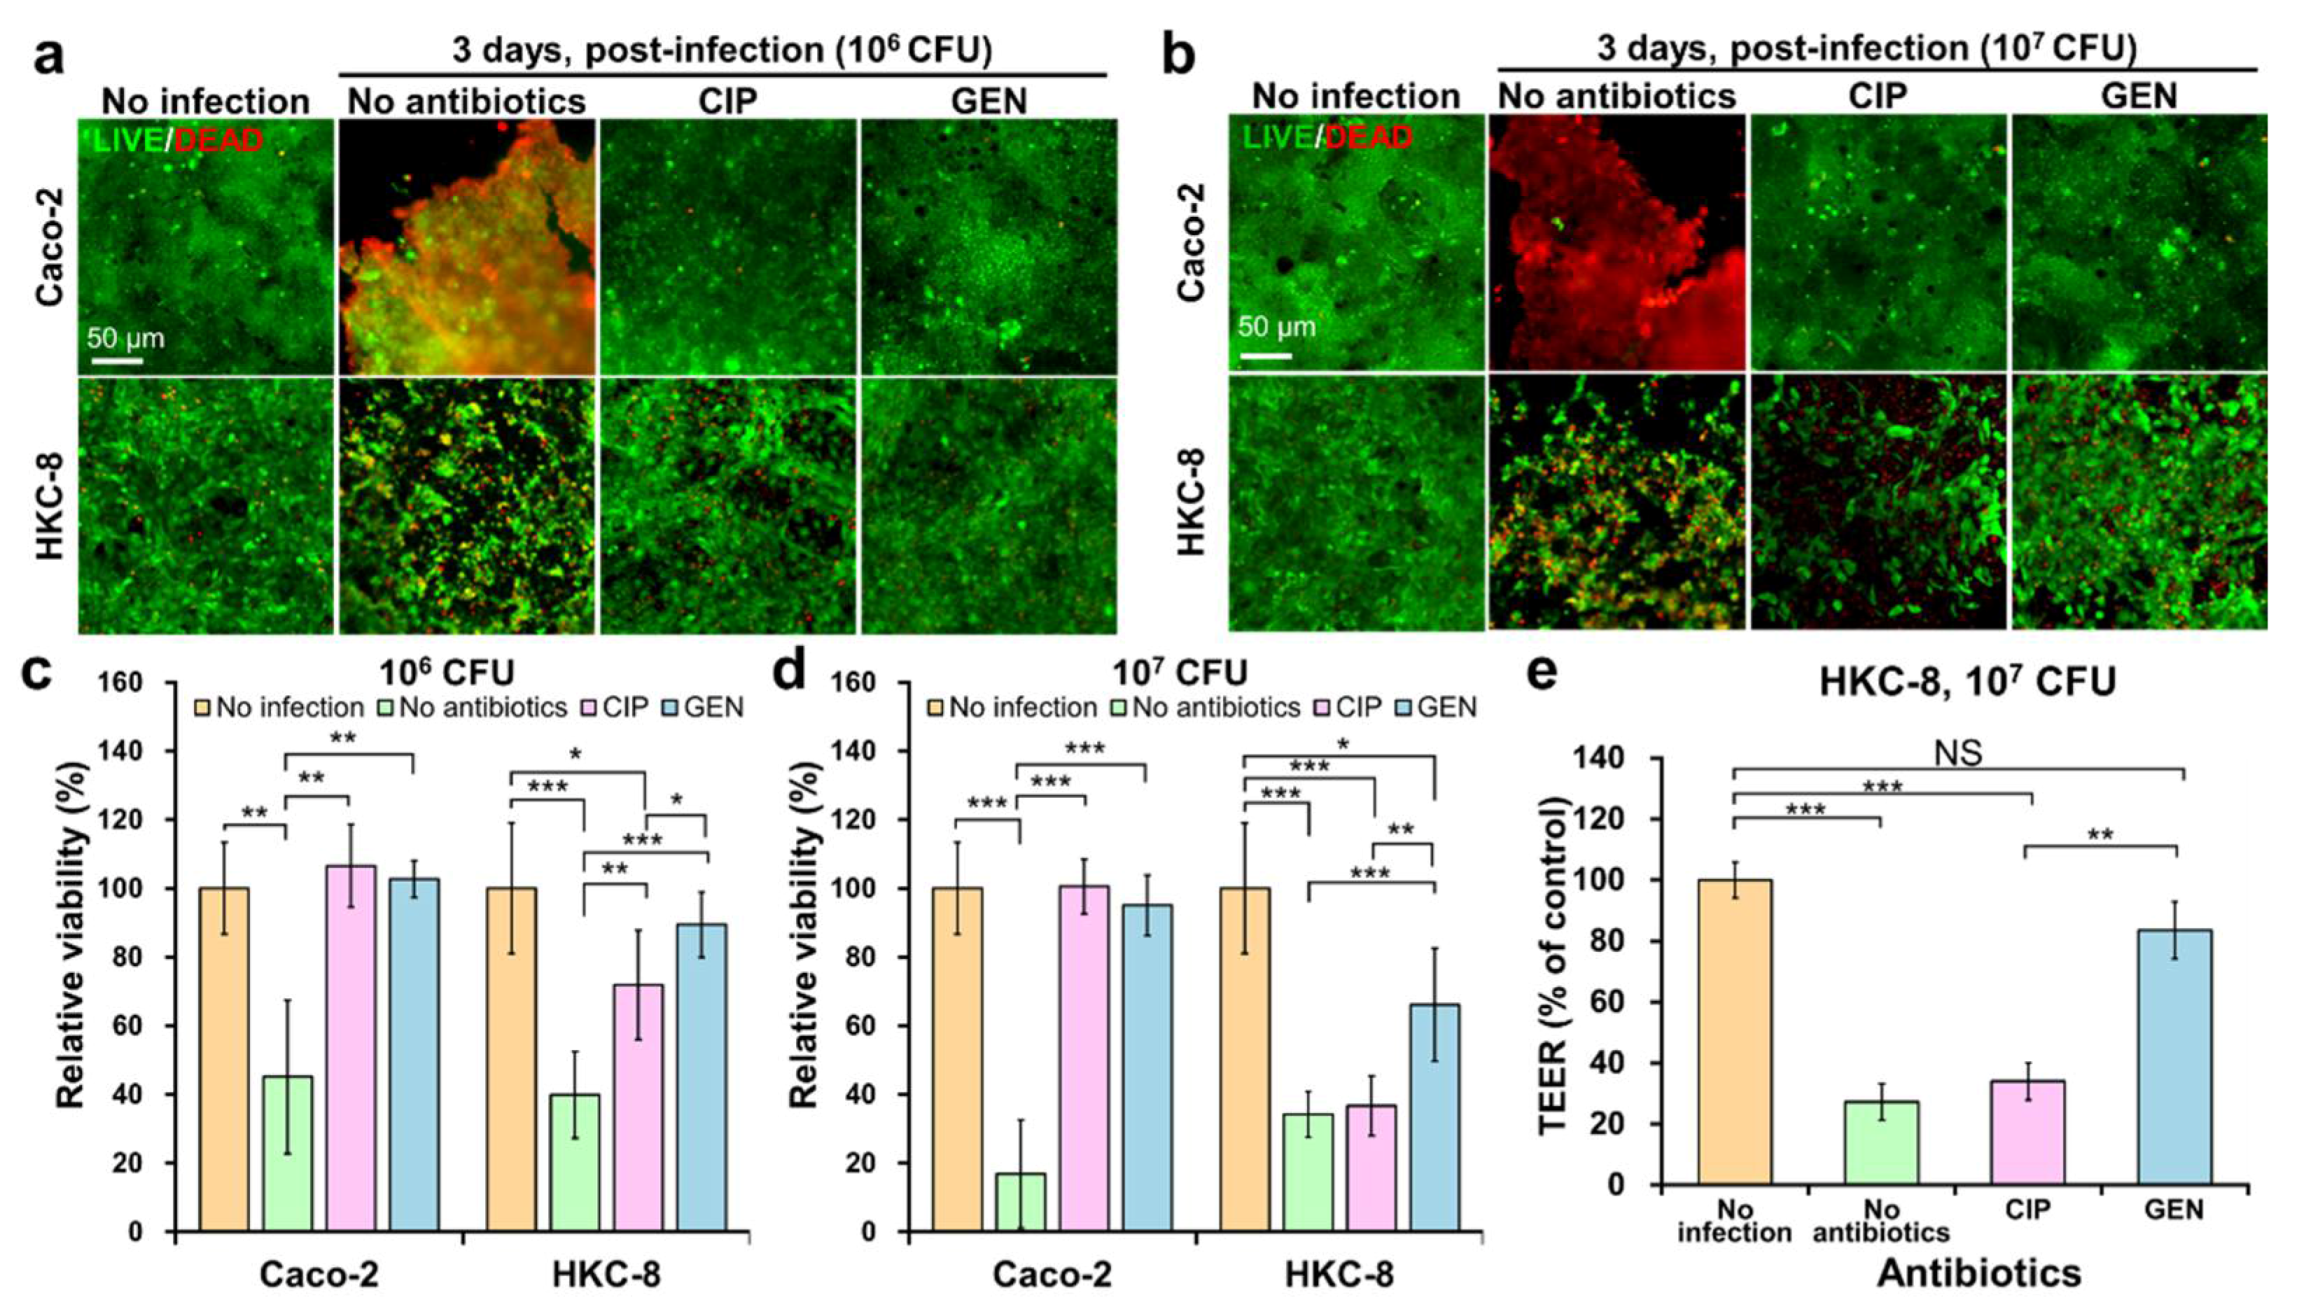
2.4. Evaluating the Risk of HUS in the Kidney by CIP and GEN Using the Chip
3. Conclusions
4. Materials and Methods
4.1. Design and Fabrication of GKA on Chip
4.2. Determining the Concentration of Antibiotics
4.3. Cell Culture
4.4. Culture of Gut and Kidney Cells on the Chip
4.5. Treatment of Stx2 on the Chip
4.6. Bacterial Culture
4.7. O157 Infection and Co-Culture
4.8. Cytotoxicity Test
4.9. Immunostaining
4.10. Transepithelial Electrical Resistance (TEER) Measurement
4.11. Numerical Simulation of Stx2 Transport in the Chip
4.12. Statistical Analysis
Supplementary Materials
Author Contributions
Funding
Institutional Review Board Statement
Informed Consent Statement
Data Availability Statement
Conflicts of Interest
References
- Frank, C.; Werber, D.; Cramer, J.P.; Askar, M.; Faber, M.; an der Heiden, M.; Bernard, H.; Fruth, A.; Prager, R.; Spode, A.; et al. Epidemic profile of Shiga-toxin-producing Escherichia coli O104:H4 outbreak in Germany. N. Engl. J. Med. 2011, 365, 1771–1780. [Google Scholar] [CrossRef] [PubMed] [Green Version]
- Luna, S.; Krishnasamy, V.; Saw, L.; Smith, L.; Wagner, J.; Weigand, J.; Tewell, M.; Kellis, M.; Penev, R.; McCullough, L. Outbreak of E. coli O157: H7 infections associated with exposure to animal manure in a rural community—Arizona and Utah, June–July 2017. Morb. Mortal. Wkly. Rep. 2018, 67, 659. [Google Scholar] [CrossRef]
- Silva, I.; Andrade, S.; Almeida, S.; Barbosa, K.; Bispo, M.; Silva, J.; Gonçalves, V.; Rodrigues, M.; Pribul, B.; Rodrigues, D.; et al. E. coli O157: H7 outbreak and hemolytic uremic syndrome in a day care center in Brazil. Int. J. Infect. Dis. 2020, 101, 137. [Google Scholar] [CrossRef]
- Karpman, D.; Hakansson, A.; Perez, M.T.; Isaksson, C.; Carlemalm, E.; Caprioli, A.; Svanborg, C. Apoptosis of renal cortical cells in the hemolytic-uremic syndrome: In vivo and in vitro studies. Infect. Immun. 1998, 66, 636–644. [Google Scholar] [CrossRef] [PubMed] [Green Version]
- Kielstein, J.T.; Beutel, G.; Fleig, S.; Steinhoff, J.; Meyer, T.N.; Hafer, C.; Kuhlmann, U.; Bramstedt, J.; Panzer, U.; Vischedyk, M.; et al. Best supportive care and therapeutic plasma exchange with or without eculizumab in Shiga-toxin-producing E. coli O104:H4 induced haemolytic-uraemic syndrome: An analysis of the German STEC-HUS registry. Nephrol. Dial. Transplant. 2012, 27, 3807–3815. [Google Scholar] [CrossRef] [PubMed] [Green Version]
- Lee, M.S.; Tesh, V.L. Roles of Shiga Toxins in Immunopathology. Toxins 2019, 11, 212. [Google Scholar] [CrossRef] [PubMed] [Green Version]
- Tironi-Farinati, C.; Loidl, C.F.; Boccoli, J.; Parma, Y.; Fernandez-Miyakawa, M.E.; Goldstein, J. Intracerebroventricular Shiga toxin 2 increases the expression of its receptor globotriaosylceramide and causes dendritic abnormalities. J. Neuroimmunol. 2010, 222, 48–61. [Google Scholar] [CrossRef]
- Chan, Y.S.; Ng, T.B. Shiga toxins: From structure and mechanism to applications. Appl. Microbiol. Biotechnol. 2016, 100, 1597–1610. [Google Scholar] [CrossRef]
- Hall, G.; Kurosawa, S.; Stearns-Kurosawa, D.J. Shiga Toxin Therapeutics: Beyond Neutralization. Toxins 2017, 9, 291. [Google Scholar] [CrossRef] [Green Version]
- Nguyen, D.T.T.; Van Noort, D.; Jeong, I.-K.; Park, S. Endocrine system on chip for a diabetes treatment model. Biofabrication 2017, 9, 015021. [Google Scholar] [CrossRef]
- Chi, M.; Yi, B.; Oh, S.; Park, D.-J.; Sung, J.H.; Park, S. A microfluidic cell culture device (μFCCD) to culture epithelial cells with physiological and morphological properties that mimic those of the human intestine. Biomed. Microdevices 2015, 17, 58. [Google Scholar] [CrossRef]
- Low, L.A.; Mummery, C.; Berridge, B.R.; Austin, C.P.; Tagle, D.A. Organs-on-chips: Into the next decade. Nat. Rev. Drug Discov. 2021, 20, 345–361. [Google Scholar] [CrossRef] [PubMed]
- Miller, P.G.; Shuler, M.L. Design and demonstration of a pumpless 14 compartment microphysiological system. Biotechnol. Bioeng. 2016, 113, 2213–2227. [Google Scholar] [CrossRef] [PubMed]
- Herland, A.; Maoz, B.M.; Das, D.; Somayaji, M.R.; Prantil-Baun, R.; Novak, R.; Cronce, M.; Huffstater, T.; Jeanty, S.S.F.; Ingram, M.; et al. Quantitative prediction of human pharmacokinetic responses to drugs via fluidically coupled vascularized organ chips. Nat. Biomed. Eng. 2020, 4, 421–436. [Google Scholar] [CrossRef] [PubMed]
- Sung, J.H.; Wang, Y.I.; Narasimhan Sriram, N.; Jackson, M.; Long, C.; Hickman, J.J.; Shuler, M.L. Recent Advances in Body-on-a-Chip Systems. Anal. Chem. 2019, 91, 330–351. [Google Scholar] [CrossRef]
- Sung, J.H.; Kam, C.; Shuler, M.L. A microfluidic device for a pharmacokinetic-pharmacodynamic (PK-PD) model on a chip. Lab Chip 2010, 10, 446–455. [Google Scholar] [CrossRef] [PubMed]
- Prantil-Baun, R.; Novak, R.; Das, D.; Somayaji, M.R.; Przekwas, A.; Ingber, D.E. Physiologically Based Pharmacokinetic and Pharmacodynamic Analysis Enabled by Microfluidically Linked Organs-on-Chips. Annu. Rev. Pharmacol. Toxicol. 2018, 58, 37–64. [Google Scholar] [CrossRef] [PubMed]
- Lee, S.H.; Choi, N.; Sung, J.H. Pharmacokinetic and pharmacodynamic insights from microfluidic intestine-on-a-chip models. Expert Opin. Drug Metab. Toxicol. 2019, 15, 1005–1019. [Google Scholar] [CrossRef]
- Bein, A.; Shin, W.; Jalili-Firoozinezhad, S.; Park, M.H.; Sontheimer-Phelps, A.; Tovaglieri, A.; Chalkiadaki, A.; Kim, H.J.; Ingber, D.E. Microfluidic Organ-on-a-Chip Models of Human Intestine. CMGH Cell. Mol. Gastroenterol. Hepatol. 2018, 5, 659–668. [Google Scholar] [CrossRef] [Green Version]
- Puschhof, J.; Pleguezuelos-Manzano, C.; Clevers, H. Organoids and organs-on-chips: Insights into human gut-microbe interactions. Cell Host Microbe 2021, 29, 867–878. [Google Scholar] [CrossRef]
- Picollet-D’hahan, N.; Zuchowska, A.; Lemeunier, I.; Le Gac, S. Multiorgan-on-a-chip: A systemic approach to model and decipher inter-organ communication. Trends Biotechnol. 2021, 39, 788–810. [Google Scholar] [CrossRef] [PubMed]
- Edington, C.D.; Chen, W.L.K.; Geishecker, E.; Kassis, T.; Soenksen, L.R.; Bhushan, B.M.; Freake, D.; Kirschner, J.; Maass, C.; Tsamandouras, N.; et al. Interconnected Microphysiological Systems for Quantitative Biology and Pharmacology Studies. Sci. Rep. 2018, 8, 4530. [Google Scholar] [CrossRef] [Green Version]
- Vis, M.A.; Ito, K.; Hofmann, S. Impact of Culture Medium on Cellular Interactions in in vitro Co-culture Systems. Front. Bioeng. Biotechnol. 2020, 8, 911. [Google Scholar] [CrossRef] [PubMed]
- Yeste, J.; Illa, X.; Alvarez, M.; Villa, R. Engineering and monitoring cellular barrier models. J. Biol. Eng. 2018, 12, 18. [Google Scholar] [CrossRef]
- Hurley, B.P.; Jacewicz, M.; Thorpe, C.M.; Lincicome, L.L.; King, A.J.; Keusch, G.T.; Acheson, D.W. Shiga toxins 1 and 2 translocate differently across polarized intestinal epithelial cells. Infect. Immun. 1999, 67, 6670–6677. [Google Scholar] [CrossRef] [Green Version]
- Shim, K.Y.; Lee, D.; Han, J.; Nguyen, N.T.; Park, S.; Sung, J.H. Microfluidic gut-on-a-chip with three-dimensional villi structure. Biomed. Microdevices 2017, 19, 37. [Google Scholar] [CrossRef] [PubMed] [Green Version]
- Kimura, Y.; Shiozaki, H.; Hirao, M.; Maeno, Y.; Doki, Y.; Inoue, M.; Monden, T.; Ando-Akatsuka, Y.; Furuse, M.; Tsukita, S.; et al. Expression of occludin, tight-junction-associated protein, in human digestive tract. Am. J. Pathol. 1997, 151, 45. [Google Scholar] [PubMed]
- Coffey, S.; Costacou, T.; Orchard, T.; Erkan, E. Akt Links Insulin Signaling to Albumin Endocytosis in Proximal Tubule Epithelial Cells. PLoS ONE 2015, 10, e0140417. [Google Scholar] [CrossRef] [Green Version]
- Proulx, F.; Seidman, E.G.; Karpman, D. Pathogenesis of Shiga toxin-associated hemolytic uremic syndrome. Pediatr. Res. 2001, 50, 163–171. [Google Scholar] [CrossRef] [Green Version]
- Kouzel, I.U.; Pohlentz, G.; Schmitz, J.S.; Steil, D.; Humpf, H.U.; Karch, H.; Muthing, J. Shiga Toxin Glycosphingolipid Receptors in Human Caco-2 and HCT-8 Colon Epithelial Cell Lines. Toxins 2017, 9, 338. [Google Scholar] [CrossRef] [PubMed]
- Uchida, H.; Kiyokawa, N.; Horie, H.; Fujimoto, J.; Takeda, T. The detection of Shiga toxins in the kidney of a patient with hemolytic uremic syndrome. Pediatr. Res. 1999, 45, 133–137. [Google Scholar] [CrossRef] [PubMed] [Green Version]
- Park, S.; Worobo, R.W.; Durst, R.A. Escherichia coli O157: H7 as an emerging foodborne pathogen: A literature review. Crit. Rev. Food. Sci. Nutr. 1999, 39, 481–502. [Google Scholar] [CrossRef]
- Wong, C.S.; Jelacic, S.; Habeeb, R.L.; Watkins, S.L.; Tarr, P.I. The risk of the hemolytic-uremic syndrome after antibiotic treatment of Escherichia coli O157:H7 infections. N. Engl. J. Med. 2000, 342, 1930–1936. [Google Scholar] [CrossRef] [Green Version]
- Corogeanu, D.; Willmes, R.; Wolke, M.; Plum, G.; Utermohlen, O.; Kronke, M. Therapeutic concentrations of antibiotics inhibit Shiga toxin release from enterohemorrhagic E. coli O104:H4 from the 2011 German outbreak. BMC Microbiol. 2012, 12, 160. [Google Scholar] [CrossRef] [PubMed] [Green Version]
- Zhang, X.; McDaniel, A.D.; Wolf, L.E.; Keusch, G.T.; Waldor, M.K.; Acheson, D.W. Quinolone antibiotics induce Shiga toxin-encoding bacteriophages, toxin production, and death in mice. J. Infect. Dis. 2000, 181, 664–670. [Google Scholar] [CrossRef]
- Bauwens, A.; Kunsmann, L.; Karch, H.; Mellmann, A.; Bielaszewska, M. Antibiotic-Mediated Modulations of Outer Membrane Vesicles in Enterohemorrhagic Escherichia coli O104:H4 and O157:H7. Antimicrob. Agents Chemother. 2017, 61, e00937-17. [Google Scholar] [CrossRef] [PubMed] [Green Version]
- Bielaszewska, M.; Rüter, C.; Bauwens, A.; Greune, L.; Jarosch, K.A.; Steil, D.; Zhang, W.; He, X.; Lloubes, R.; Fruth, A.; et al. Host cell interactions of outer membrane vesicle-associated virulence factors of enterohemorrhagic Escherichia coli O157: Intracellular delivery, trafficking and mechanisms of cell injury. PLoS Pathog. 2017, 13, e1006159. [Google Scholar] [CrossRef]
- Zoja, C.; Angioletti, S.; Donadelli, R.; Zanchi, C.; Tomasoni, S.; Binda, E.; Imberti, B.; Te Loo, M.; Monnens, L.; Remuzzi, G. Shiga toxin-2 triggers endothelial leukocyte adhesion and transmigration via NF-κB dependent up-regulation of IL-8 and MCP-11. Kidney Int. 2002, 62, 846–856. [Google Scholar] [CrossRef] [Green Version]
- Keir, L.S.; Marks, S.D.; Kim, J.J. Shiga toxin-associated hemolytic uremic syndrome: Current molecular mechanisms and future therapies. Drug Des. Devel. Ther. 2012, 6, 195–208. [Google Scholar] [PubMed] [Green Version]
- Ramegowda, B.; Tesh, V.L. Differentiation-associated toxin receptor modulation, cytokine production, and sensitivity to Shiga-like toxins in human monocytes and monocytic cell lines. Infect. Immun. 1996, 64, 1173–1180. [Google Scholar] [CrossRef] [Green Version]
- Mayer, C.L.; Parello, C.S.; Lee, B.C.; Itagaki, K.; Kurosawa, S.; Stearns-Kurosawa, D.J. Pro-Coagulant Endothelial Dysfunction Results from EHEC Shiga Toxins and Host Damage-Associated Molecular Patterns. Front. Immunol. 2015, 6, 155. [Google Scholar] [CrossRef] [Green Version]
- Kwak, B.S.; Jin, S.P.; Kim, S.J.; Kim, E.J.; Chung, J.H.; Sung, J.H. Microfluidic skin chip with vasculature for recapitulating the immune response of the skin tissue. Biotechnol. Bioeng. 2020, 117, 1853–1863. [Google Scholar] [CrossRef] [PubMed]
- Agger, M.; Scheutz, F.; Villumsen, S.; Mølbak, K.; Petersen, A.M. Antibiotic treatment of verocytotoxin-producing Escherichia coli (VTEC) infection: A systematic review and a proposal. J. Antimicrob. Chemother. 2015, 70, 2440–2446. [Google Scholar] [CrossRef] [PubMed] [Green Version]
- Xia, Y.; Whitesides, G.M. Soft Lithography. Angew. Chem. Int. Ed. Engl. 1998, 37, 550–575. [Google Scholar] [CrossRef]
- Wiegand, I.; Hilpert, K.; Hancock, R.E. Agar and broth dilution methods to determine the minimal inhibitory concentration (MIC) of antimicrobial substances. Nat. Protoc. 2008, 3, 163–175. [Google Scholar] [CrossRef]
- Kodama, T.; Nagayama, K.; Yamada, K.; Ohba, Y.; Akeda, Y.; Honda, T. Induction of apoptosis in human renal proximal tubular epithelial cells by Escherichia coli verocytotoxin 1 in vitro. Med. Microbiol. Immunol. 1999, 188, 73–78. [Google Scholar] [CrossRef] [PubMed]
- Lee, D.W.; Choi, N.; Sung, J.H. A microfluidic chip with gravity-induced unidirectional flow for perfusion cell culture. Biotechnol. Prog. 2019, 35, e2701. [Google Scholar] [CrossRef] [Green Version]
- Schuller, S. Shiga toxin interaction with human intestinal epithelium. Toxins 2011, 3, 626–639. [Google Scholar] [CrossRef] [Green Version]
- Obrig, T.G.; Louise, C.B.; Lingwood, C.A.; Boyd, B.; Barley-Maloney, L.; Daniel, T.O. Endothelial heterogeneity in Shiga toxin receptors and responses. J. Biol. Chem. 1993, 268, 15484–15488. [Google Scholar] [CrossRef]


Publisher’s Note: MDPI stays neutral with regard to jurisdictional claims in published maps and institutional affiliations. |
© 2021 by the authors. Licensee MDPI, Basel, Switzerland. This article is an open access article distributed under the terms and conditions of the Creative Commons Attribution (CC BY) license (https://creativecommons.org/licenses/by/4.0/).
Share and Cite
Lee, Y.; Kim, M.-H.; Alves, D.R.; Kim, S.; Lee, L.P.; Sung, J.H.; Park, S. Gut–Kidney Axis on Chip for Studying Effects of Antibiotics on Risk of Hemolytic Uremic Syndrome by Shiga Toxin-Producing Escherichia coli. Toxins 2021, 13, 775. https://doi.org/10.3390/toxins13110775
Lee Y, Kim M-H, Alves DR, Kim S, Lee LP, Sung JH, Park S. Gut–Kidney Axis on Chip for Studying Effects of Antibiotics on Risk of Hemolytic Uremic Syndrome by Shiga Toxin-Producing Escherichia coli. Toxins. 2021; 13(11):775. https://doi.org/10.3390/toxins13110775
Chicago/Turabian StyleLee, Yugyeong, Min-Hyeok Kim, David Rodrigues Alves, Sejoong Kim, Luke P. Lee, Jong Hwan Sung, and Sungsu Park. 2021. "Gut–Kidney Axis on Chip for Studying Effects of Antibiotics on Risk of Hemolytic Uremic Syndrome by Shiga Toxin-Producing Escherichia coli" Toxins 13, no. 11: 775. https://doi.org/10.3390/toxins13110775